Источник:
https://www.powerobjects.com/2018/08...tion-power-bi/
==============

Power BI is a Business Analytics tool that provides interactive visualization and allows end users to create reports and dashboards. We can connect a number of data sources to Power BI including data files, online and on-premises services, and Azure.
Power BI Installation
We need the Power BI Desktop application to develop Power BI reports. We can easily get the latest version of Power BI Desktop application from the Microsoft Power BI website. Once downloaded and installed sign up and sign in using your Power BI or Office 365 credentials.
 Getting Data from Data Sources to Power BI
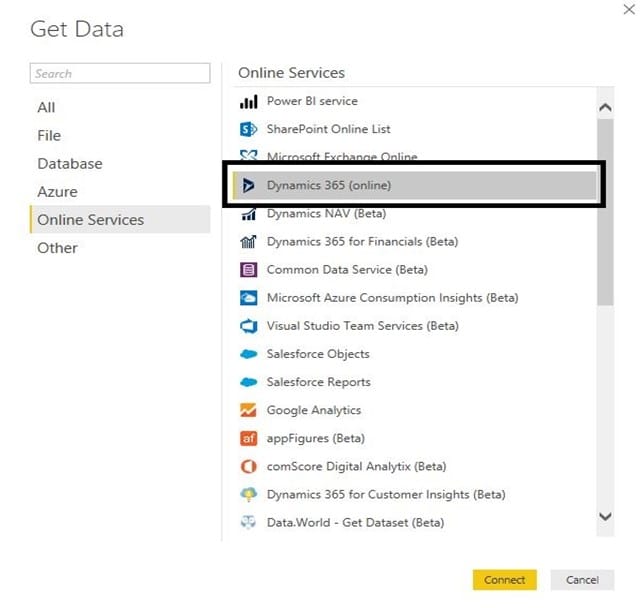
Once we complete sign in to Power BI our next step is to get the data from Data Sources including data files, online Services and on-premises Services, Azure, etc. Here we will investigate how we should connect Dynamics 365 Online to Power BI and generate reports using Dynamics 365 data.
 Connecting Dynamics 365 to Power BI
Once we select the Dynamics 365 Data source in Power BI by using the Service Root URL, we should be able to connect to our Dynamics 365 instance. To achieve this functionality, follow the steps below.
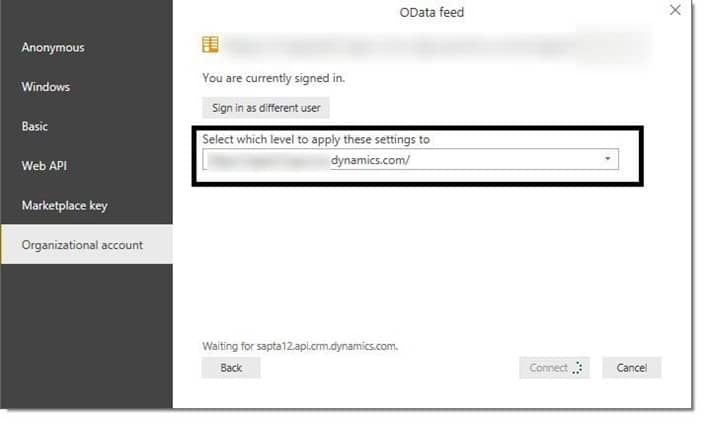
Dynamics 365 > Settings > Customizations > Developer Resources > Service Root URL

Copy the Service Root URL and add it to Power BI for the organizational account and change or update version 9.0 to 8.2 because 9.0 version is not supported by Power BI yet.
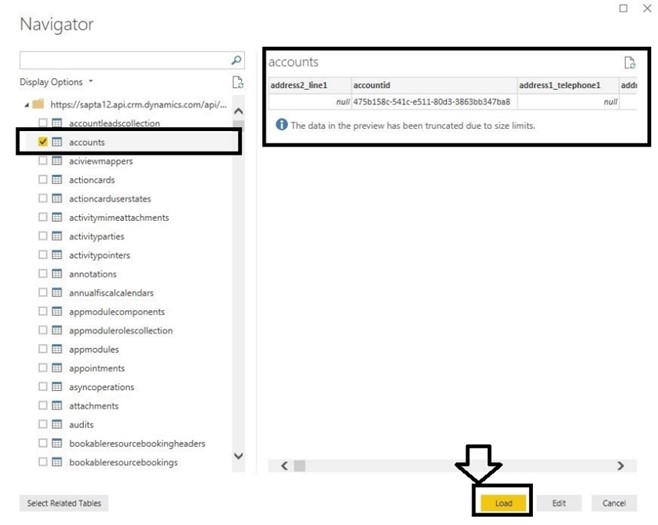
After connecting Dynamics 365 to Power BI successfully, we need to select the Dynamics 365 entities – either System Entities or Custom Entities to generate reports. After selecting the entities, click on the Load button and the entities will load into Power BI.
Selecting Entities
 Customizing the Entities
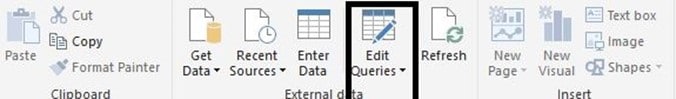
When the Entities are loaded, we can begin to generate reports. For example, if we want to remove some fields from an entity, rename the fields, remove the duplicates, split columns, or directly add a new field to the entity table – we can achieve all these by going to the Edit Queries button.
 Visualization
When all the customizations required are completed, the next step is to create or visualize the report by using different visualization options like Stacked Bar Chart, Stacked Column chart, Pie Chart, Donut Chart, Funnel Chart, etc. After completing visualizations, we can publish that dashboard.
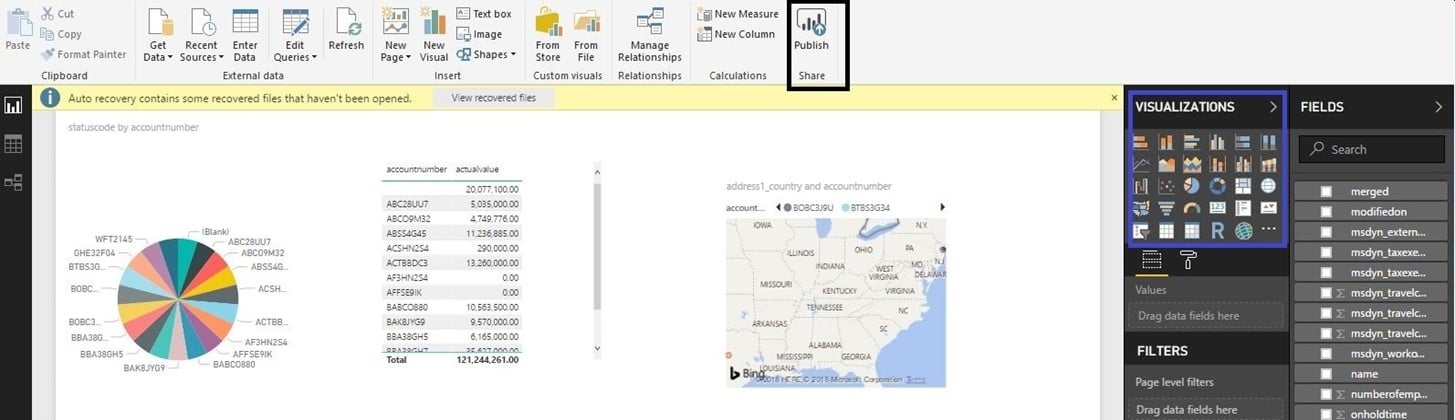
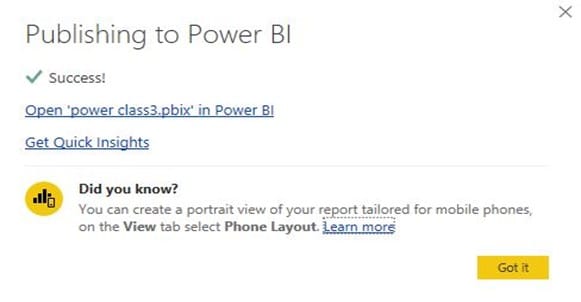
Once we successfully publish our Dashboard, sign in to the online version of Power BI. Our Dashboard is now available to view or share with a single user or the entire organization. We also have the option to surface this dashboard in Dynamics 365.

As you can see, Power BI provides some great features to create dashboard visualizations! You can learn more about business intelligence for Dynamics 365 in this
on-demand webinar.
Be sure to subscribe to our blog for more Dynamics 365 info!
Happy Dynamics 365’ing!
Источник:
https://www.powerobjects.com/2018/08...tion-power-bi/