Источник:
https://kurthatlevik.wordpress.com/2...-debugdevelop/
==============
The new Dynamics AX have some very powerful capabilities to show exactly where time is spent. You would like to explore more about what is happening behind the scene, try adding the “
&debug=develop” to the URL. This will bring up a small timer that shows how much time was spent on opening and showing the current form.
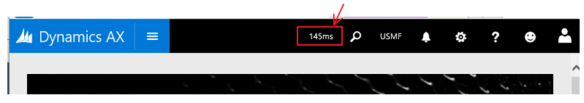
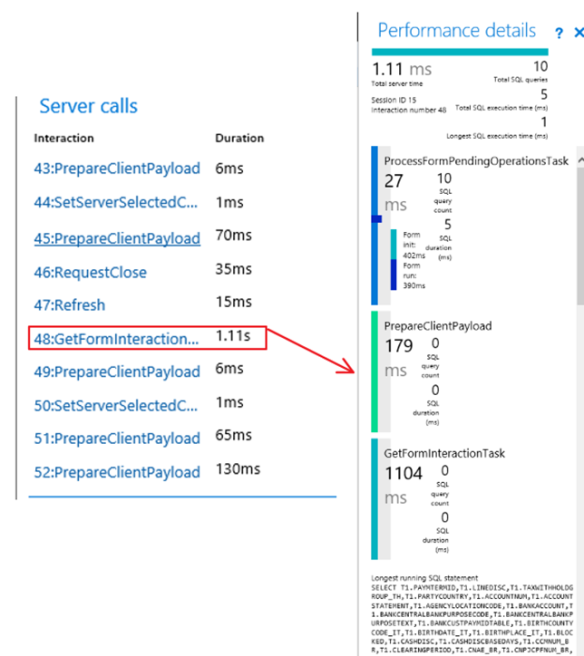
If you click on it, it will give more performance details. Like if I open the all customers in the Contoso form, my system gives me the following.

I see here that the loading the customers took 366 ms, where 131 ms was from the AOS loading the data. You also see a color coding (green/blue) that indicates at what sequence the time was spent.
There is also a section to show what the server is doing, and it also shows you the exact SQL call that was the longest running SQL statement.
At the bottom of the performance screen we can also see something interesting;
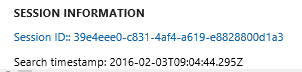
And when I click on this Session ID, I get;

I have no clue what that is
J, but could this be a tool for external monitoring ?


Источник:
https://kurthatlevik.wordpress.com/2...-debugdevelop/