Источник:
https://crmtipoftheday.com/1229/use-...art-look-good/
==============
It’s Friday afternoon and the management asked you to create a quick chart illustrating your team’s bug handling pipeline. Easy-peasy.
Step 1 – extract data from the Squash-A-Bug system
StatusCountNew4268Under Review1921Planned516Completed229
Step 2 – visualize it as a small dashboard:
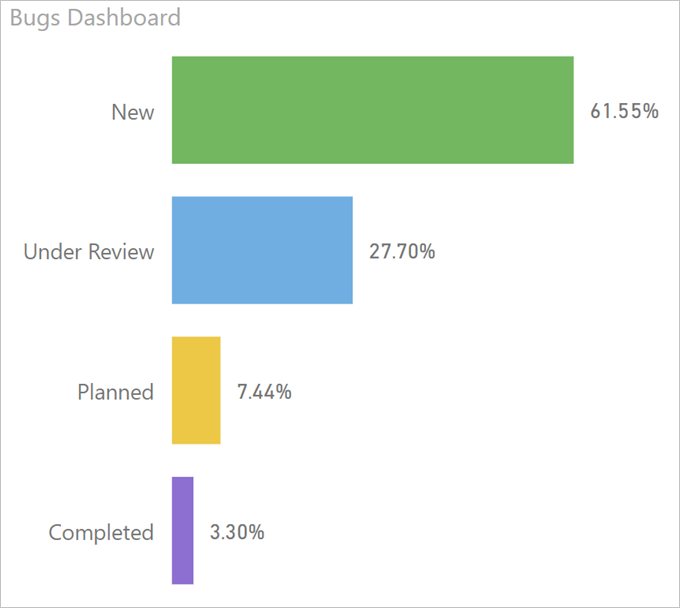
That…. does not… look… good… (tried funnel – that’s even worse)
We appear to be choking under the flood of new bugs… It’s Friday, for crying out loud, can’t give bad news to the management!
(
busily searches dusted brain corners for the high education leftovers)
Found!
Here’s your tip of the day:
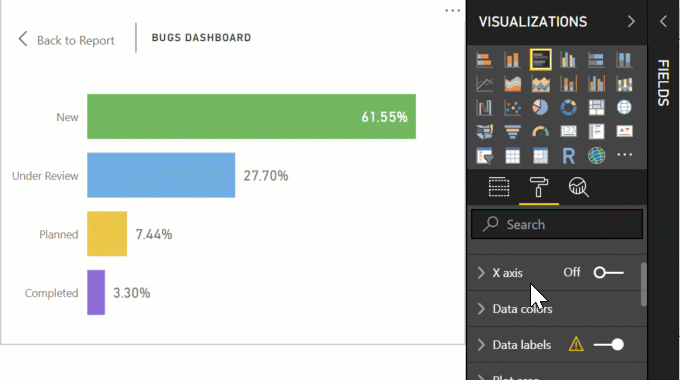
If your numbers are disproportionally skewed, use the logarithmic scale. It brings the values “closer together”
Tîpp Jäår
And the end result:
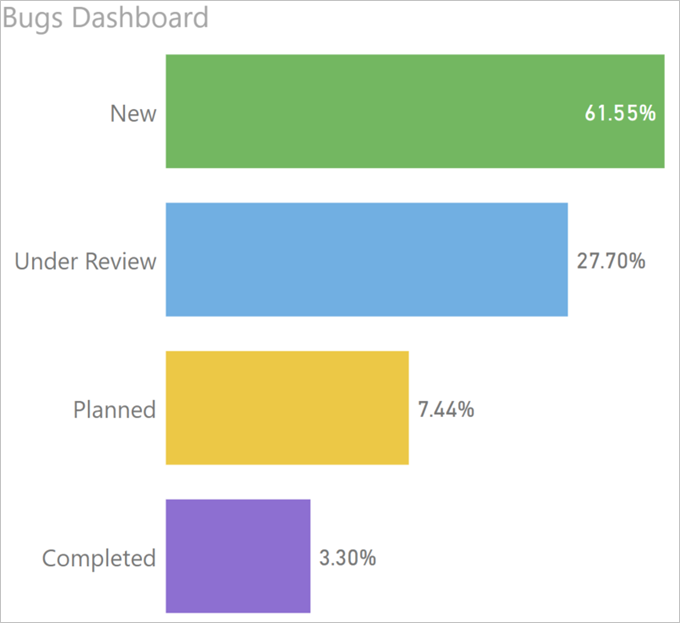
Ahhh, that’s much better. Take that, management!
Friday night, here I come!
Thank you, Dynamics 365 for the idea (pun intended), and Crissy Jarvis on Unsplash for the cover photo.
Источник:
https://crmtipoftheday.com/1229/use-...art-look-good/